Power BI Reporting
Reports people can actually decide from.
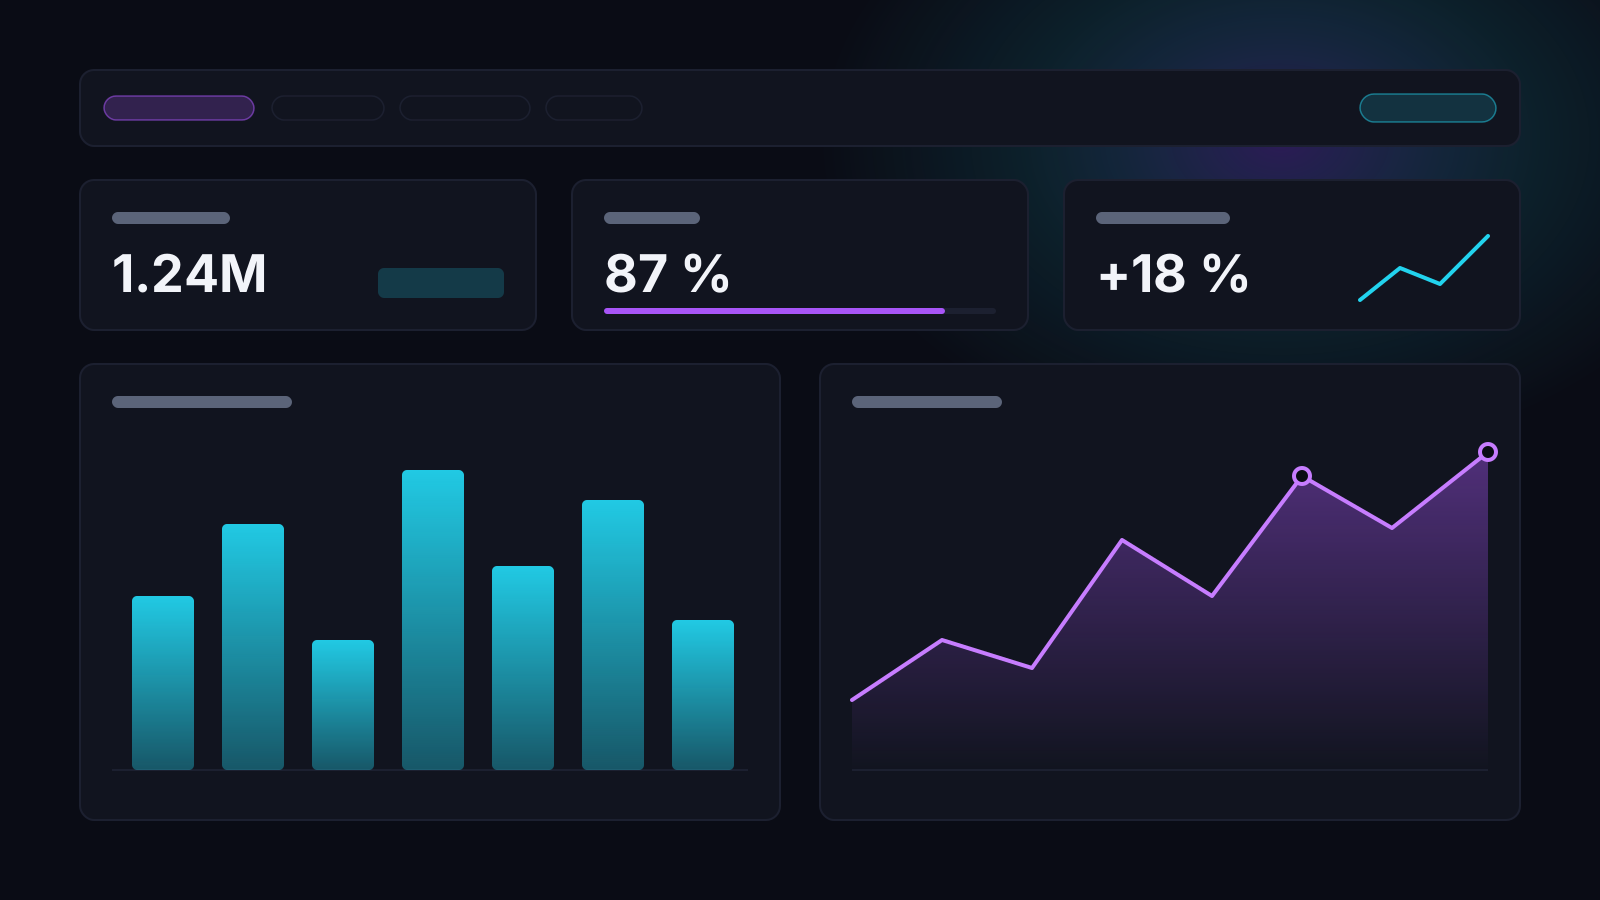
Most of this work is sales reporting. Interactive one-pager dashboards and digital platforms where reps and managers each see their own view: production, CRM data, commissions, trends, how efficiently the work runs, and how the client portfolio behaves. Showing the numbers is the easy half. I define new KPIs, check they measure what they claim to, and roll them out across the network through meetings with reps and managers — because a metric nobody can read steers nobody. Process optimisation falls out of the same work: the report shows where the time goes.
The second area is reporting for IT operations and development: SLA evaluation, views over Jira tickets, and managing the request pipeline to external IT vendors — who promised what, what actually landed, and where it stalled.
The reports themselves are not shown here, because the data is sensitive.