VyreportujTo
An AI data analyst for companies without a data team: it turns exports and queries into context, reports and dashboards.
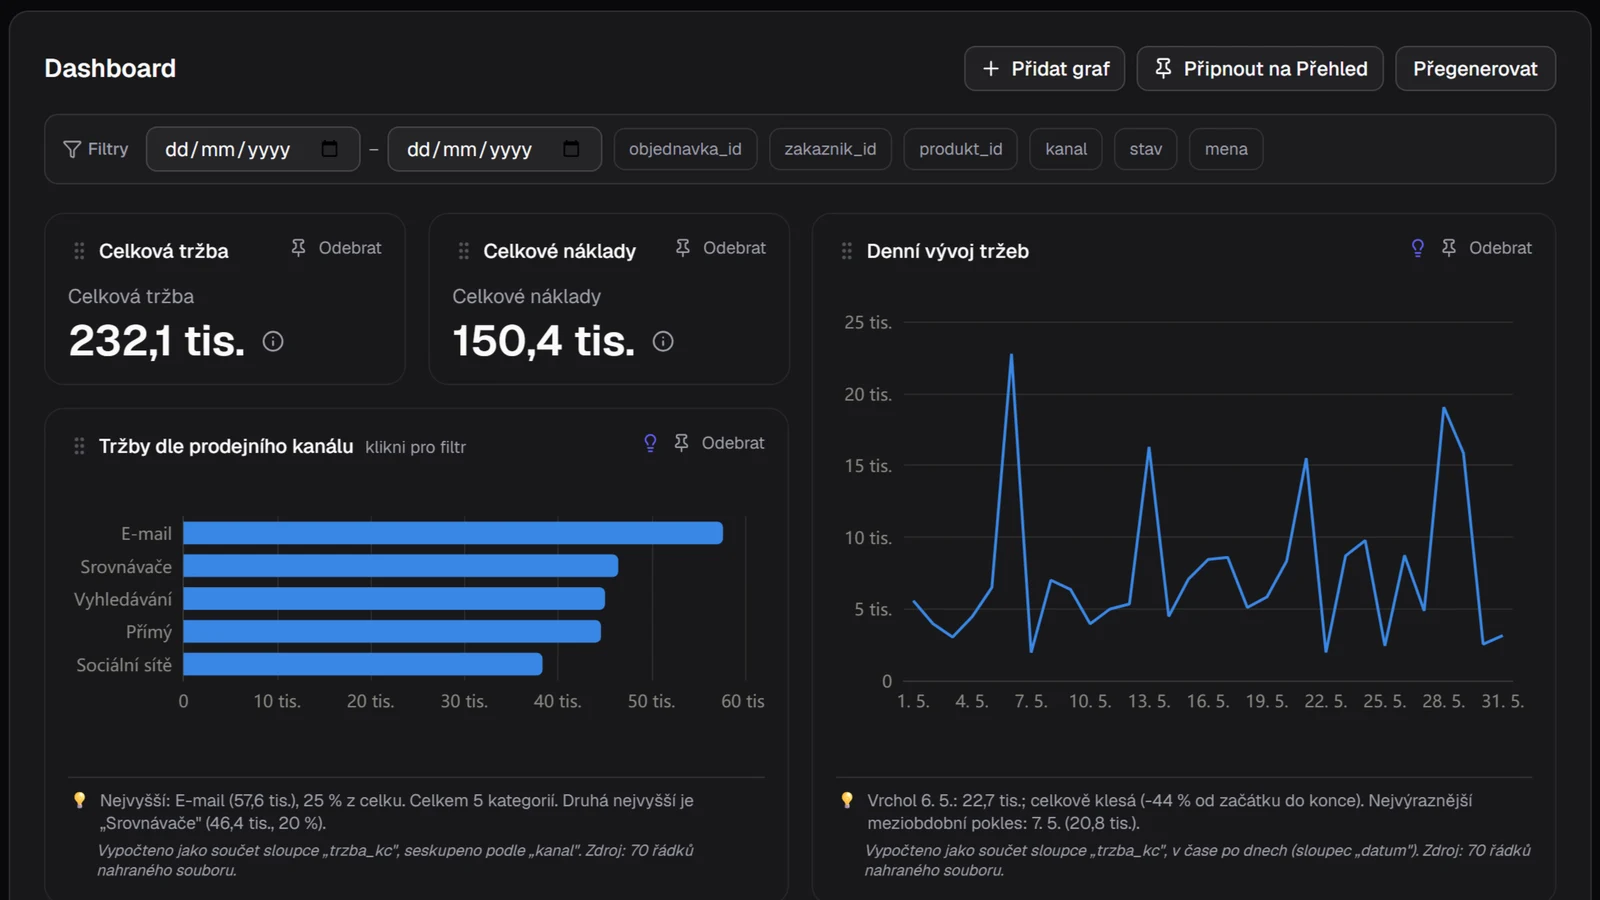
My own SaaS. Upload Excel or CSV exports, SQL or DAX queries, and the app builds a company data context from them: it knows what each column means, how the sources relate and where to look for an answer. On top of that come reports with recommendations, KPIs, interactive dashboards and a chat you can ask questions in plain language.
The core of the whole design: the AI never computes the numbers. The model plans — which source, which filter, which chart — and code computes the values over the data. The same inputs therefore give the same number, and every chart shows which column of which file it came from.
The problem it solves
Data, but no answers
Smaller companies have their data scattered across exports from the e-shop, accounting or production. Without an analyst nobody gets out of them why sales dropped or which product drives the margin.
BI needs a person
Power BI or Tableau can do a lot, but someone has to build the data model, relationships and measures. That is exactly the role a small company doesn't have.
AI chat makes things up
A generic chat over a spreadsheet computes the numbers itself — and sometimes gets them wrong. It also starts from zero every time, because it doesn't remember what each column means in your company.
How it works
- 01
Upload and cleaning
CSV, Excel, SQL or DAX. A TypeScript cleaner normalises encodings, delimiters, number and date formats and detects column types. The data is stored as rows in Postgres, so it can be queried with SQL on the server — only the result goes to the browser.
papaparseSheetJSPostgres - 02
Semantic map
A cheap model proposes the business meaning of every column and puts the source into a category. When it isn't confident, the router escalates the task to a stronger model. The model only sees the structure and five sample rows, never the whole file. You then edit and approve the map.
Smart RouterZod schema - 03
Links between sources
The app finds the keys that join sources — orders to the product list, sales to customers — and shows them as a network. A query can then join several files at once.
Join detectionGraph view - 04
Reports and dashboards
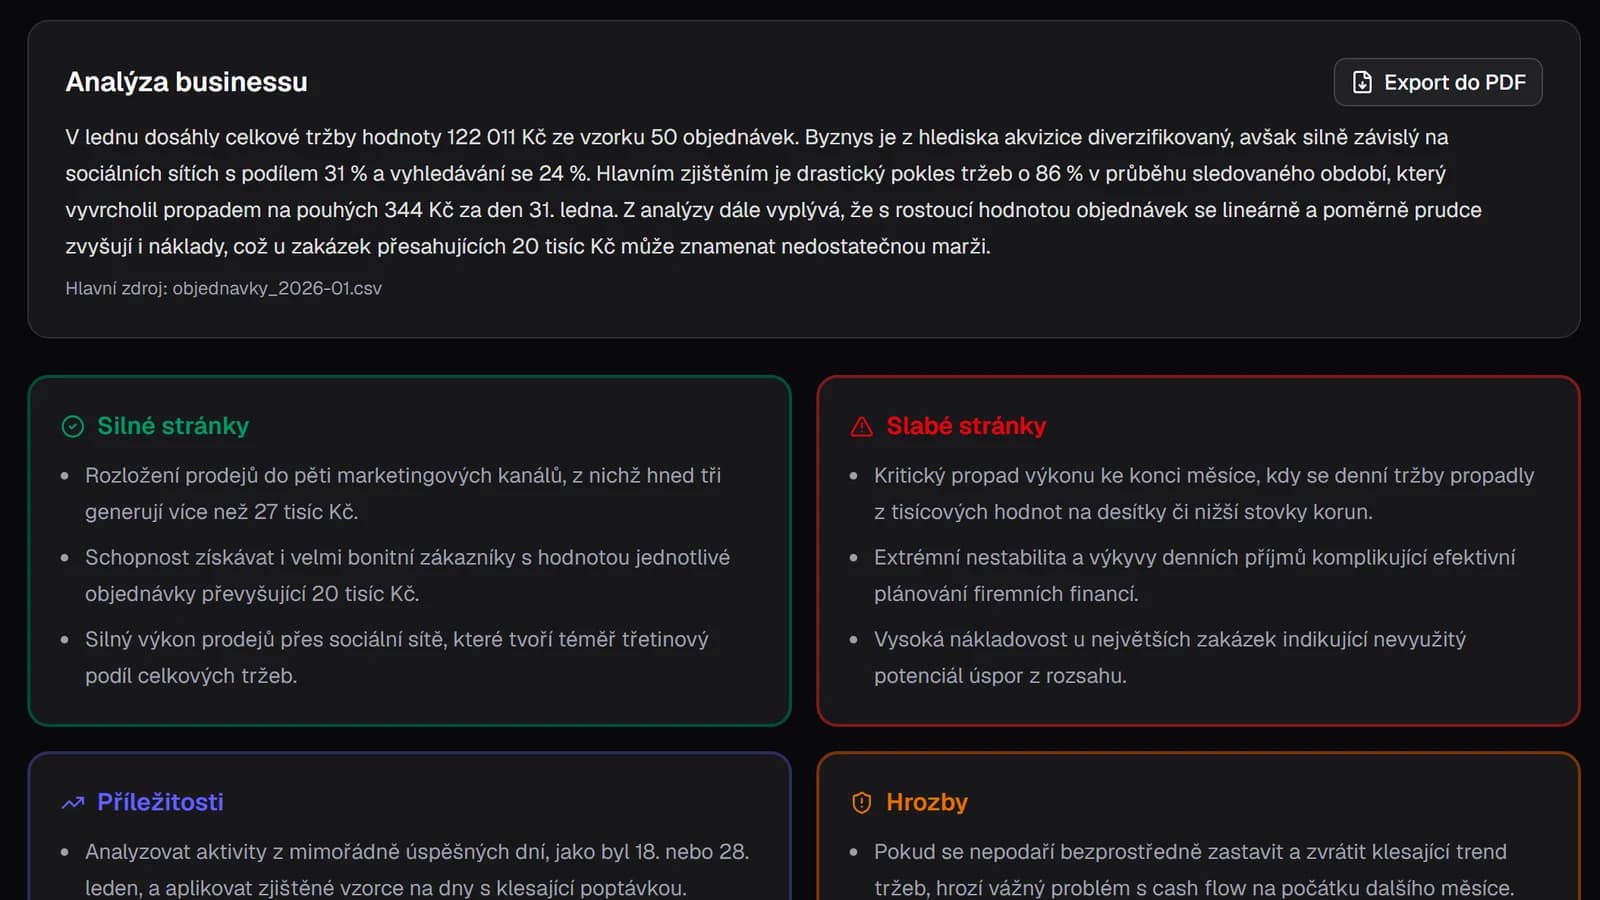
The model picks from a catalogue of 19 predefined charts and binds the columns; code computes the values and ECharts draws them. The charts act as filters for the whole dashboard. A business analysis adds a summary, SWOT and recommendations, and it all exports to PPTX.
EChartsCross-filterpptxgenjs - 05
Questions in plain language
"What are B2B sales from search?" The model plans the source, join, filter and chart as structured output, and code executes the plan. For "why" questions there is a multi-step breakdown: a plan, several computations and only then an answer over the computed facts.
Structured outputMulti-step
What sets it apart
Code computes the numbers, not AI
Unlike generic AI chats, the model doesn't add up or estimate anything. The result is reproducible, and every chart traces back to its column, file and aggregation.
Context that stays
Instead of a one-off chat you get an approved description of your company's data. It downloads as Markdown for your own AI agents — they then know your company without you explaining it again.
It understands SQL and DAX
Upload database queries or Power BI measures. The app describes tables, measures and relationships, comments the code and suggests optimisations — with versions and a diff you accept or reject.
No BI licence, no data team
The dashboard and the report assemble themselves from the exports. Nobody has to build a data model, and the output is in the user's language.
Technical design
Every major decision is written down as an ADR — why it was done this way and what was considered instead.
A Next.js and Supabase monolith
One Next.js project on Vercel: UI, route handlers and data cleaning in TypeScript, with no separate Python worker. Supabase holds Postgres, auth and files. Fewer systems, less to run, lower cost.
A model per workload
Vercel AI SDK with structured output via Zod. A modelFor(workload) function picks the model per task — routing and classification differ from analysis, SQL and DAX — and the concrete model is switched by an environment variable. In production Gemini runs through Vertex AI in the EU region. Model choice rests on measurement, not on the generation number.
Costs under control
A daily cap on AI calls per user and globally, with a separate one for the demo. Nothing runs on its own in the background — the user starts every analysis.
Tests and CI
Vitest with 41 test files — chart computation, source joins, filters. SQL is tested against PGlite, an in-memory Postgres, with no cloud database. GitHub Actions runs lint, typecheck and tests on every change.
A closer look
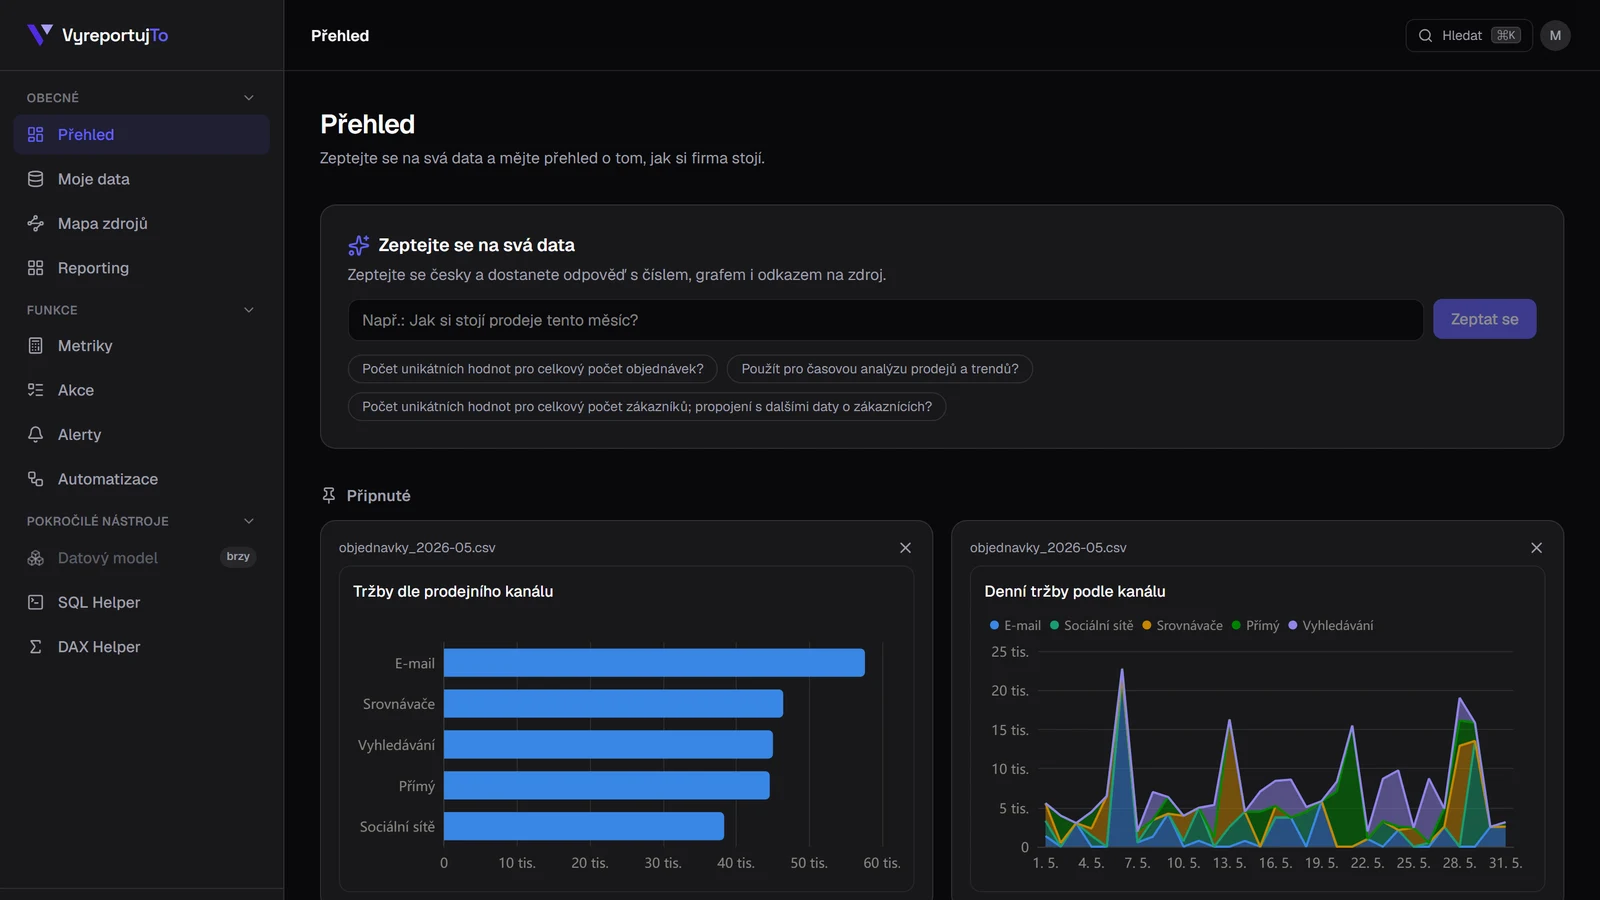
Overview
The landing screen. A question about your data asked in plain language at the top, pinned charts from recent analyses below it, and the state of every uploaded source — what is approved and what is still waiting to be processed.
Business analysis
The output over selected sources: a written summary first, then strengths, weaknesses, opportunities and threats, and only then the charts. Every claim points back at its source file, and the whole thing exports to PDF or PPTX.